
The Specification #1
71% of active management is pattern. Here's what the other 29% requires.

The tools allocators use to evaluate active managers were built for a different era, where the black box was harder to measure.
That is changing. A series of research papers published over the past few weeks, from Harvard, ADIA Lab, Man Group, Oxford, BlackRock and Barclays, each approaches the same problem from a different angle. Taken together, they make the same point: the gap between what managers claim and what allocators can verify has never been wider, and it is now measurable.
This issue covers two findings in depth:
Seventy-one percent of active fund managers’ trades can be predicted in advance by a simple AI model.
The one approach that could generate genuine structural edge, causal inference at scale, requires a simulation infrastructure that almost no one has built.
The first finding tells you how much of today’s active management is pattern. The second tells you what real edge looks like. The distance between the two is where this newsletter lives. Let’s dive in.
What you are actually paying for
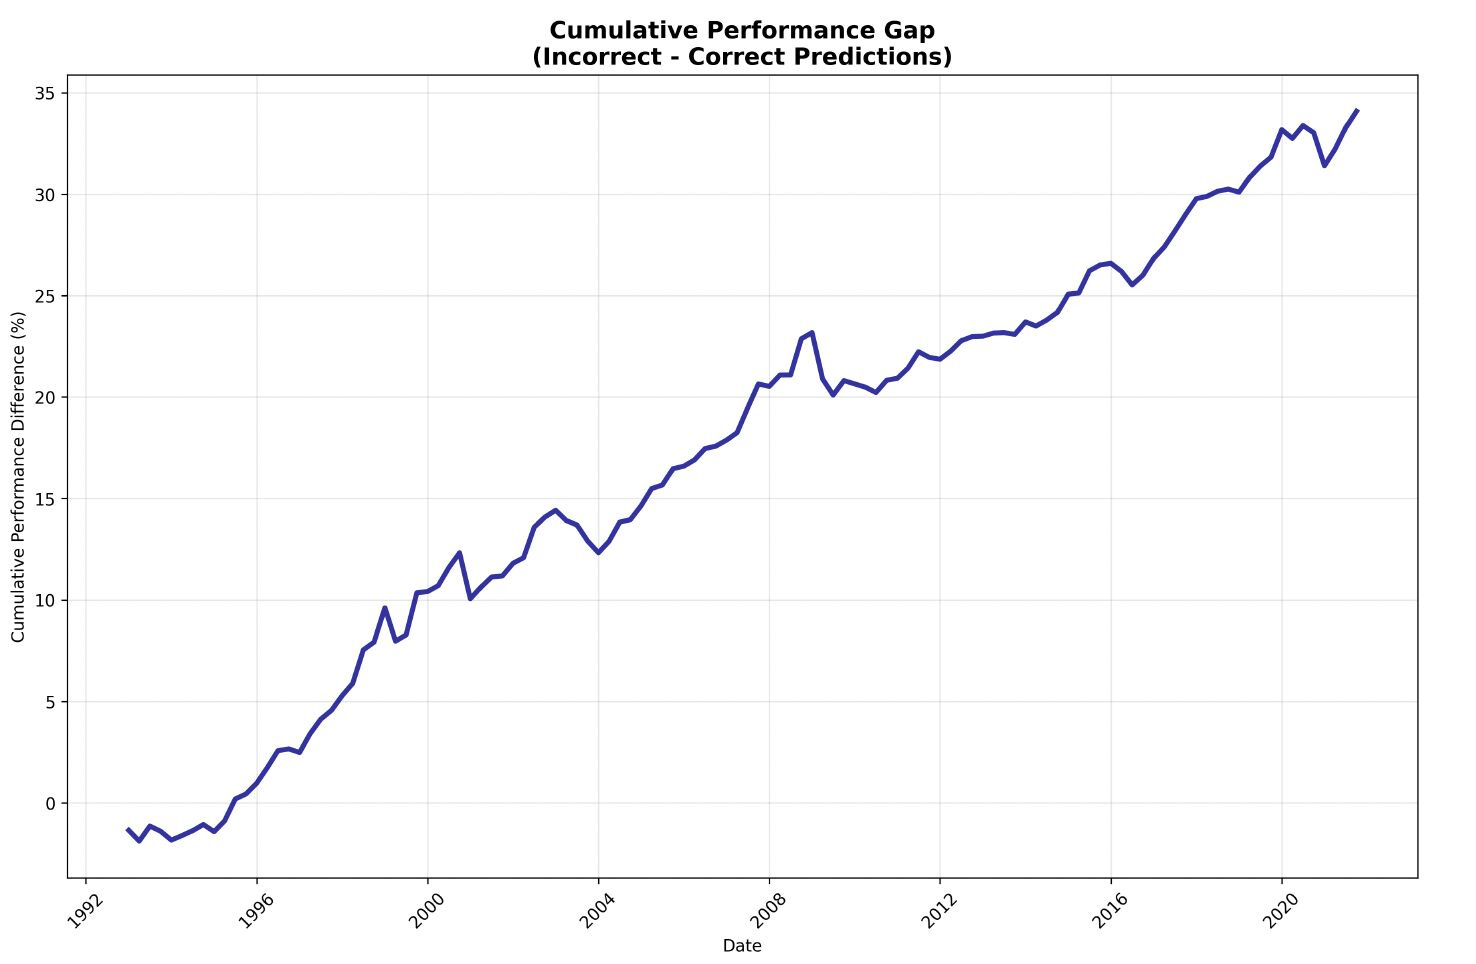
Researchers from Harvard, Wharton and DePaul trained a simple AI model on 1,706 active equity funds across thirty years of data. The question was straightforward: given a manager’s past trading history, can you predict how they will rebalance next quarter? The answer was yes, 71% of the time. The naive benchmark, simply guessing the most common action, gets you 52%. That 19-point gap is the measurement of something the industry has debated qualitatively for decades.
The more important finding is at the extremes. Managers whose trades are least predictable outperform their peers by 79 basis points cumulatively over four quarters. Managers whose trades are most predictable systematically underperform. The relationship is nearly monotonic across all five quintiles.
This is not a story about AI being smarter than fund managers but about what active management fees are supposed to compensate for, and how much of current practice actually qualifies.
Two details matter. Longer tenure increases predictability. Higher personal ownership decreases it. Everything a standard due diligence questionnaire rewards, long tenure, multiple funds, consistent style, predicts the mechanical 71%. The non-predictable portion generates all the outperformance.
Lesson: the managers worth finding are the ones a neural net cannot explain. Most DDQs are not designed to find them.
The infrastructure problem
If 71% of active management is pattern, the obvious question is what the other 29% looks like. Part of the answer came from Abu Dhabi.
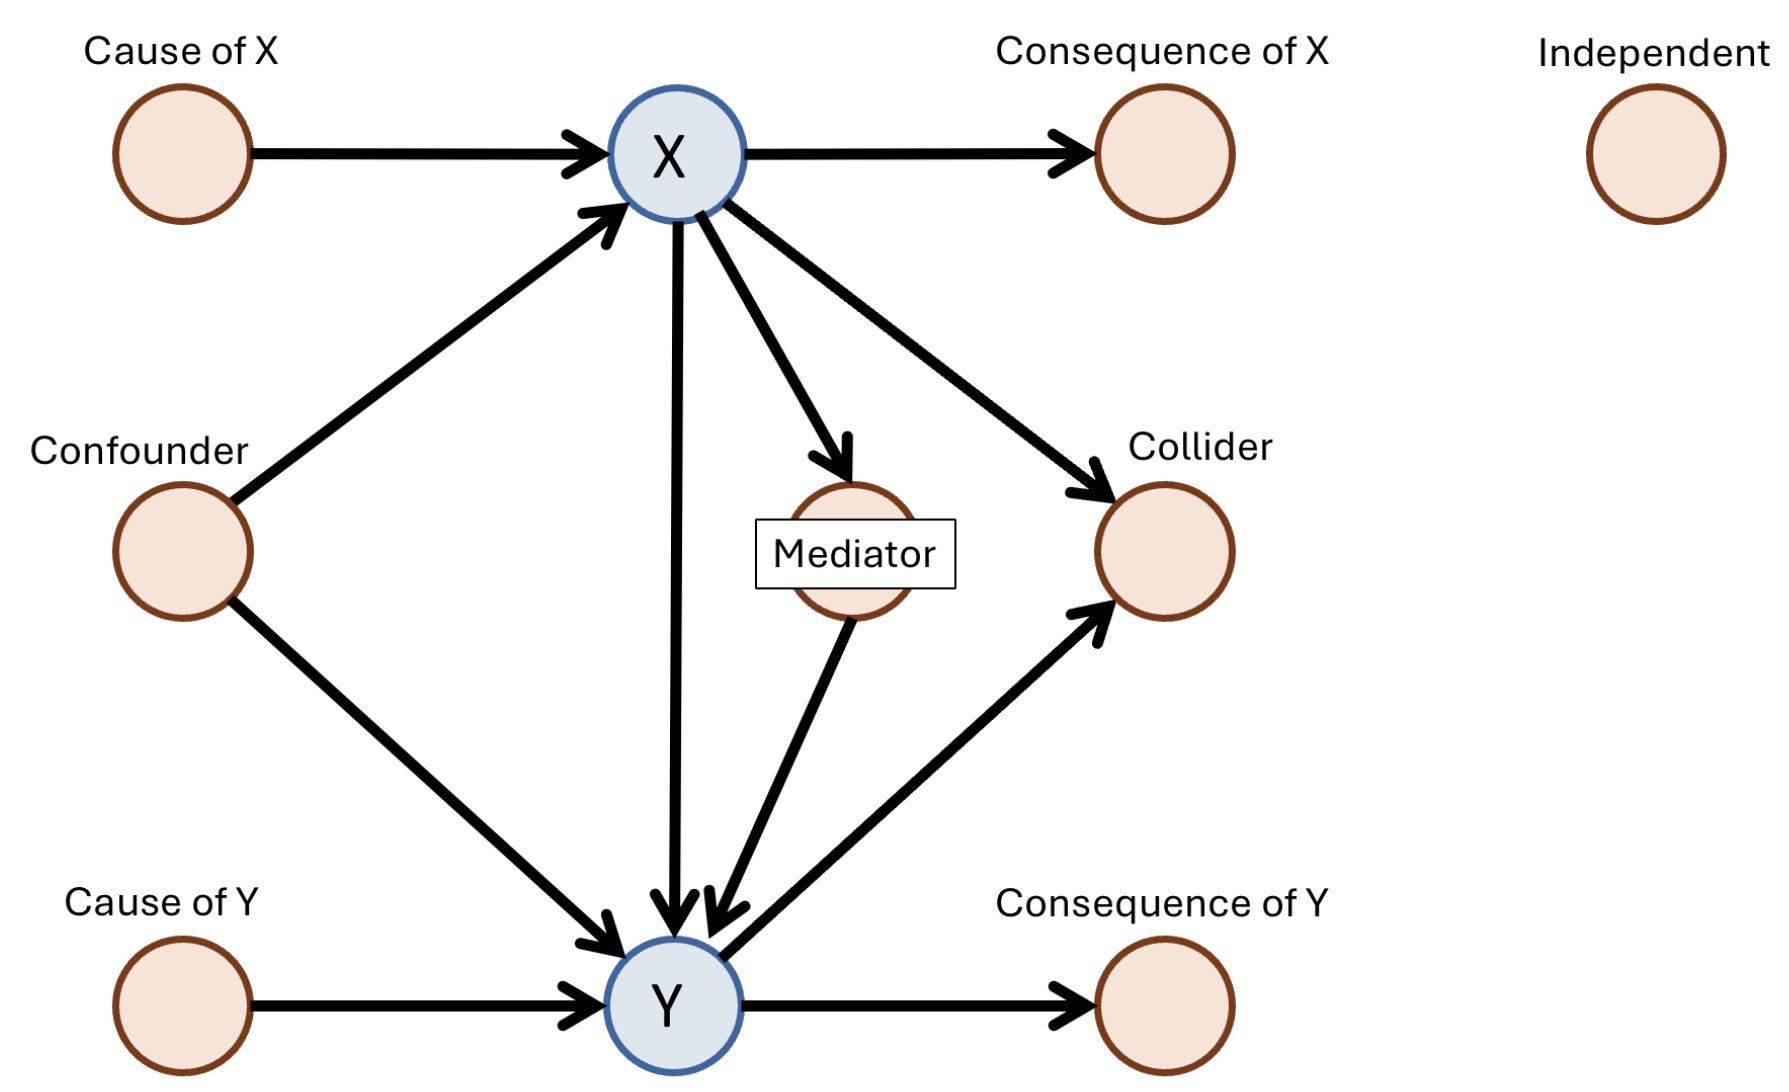
ADIA Lab ran a global causal discovery competition in 2024. Nearly 2,000 researchers submitted 3,343 solutions to a single problem: given observational data, can you identify the causal structure underneath it? The winning algorithm reached 76.7% accuracy against a 40% baseline. The method was clear: supervised learning on labeled examples dramatically outperforms classical causal discovery approaches.
But the winning approaches were not discovering causal structure in the traditional sense. They were learning what it looks like from 25,000 labeled simulations, then pattern-matching on new data. Classical causal discovery algorithms, the kind built to work without an answer key, were also tested and substantially underperformed. The condition that made 76.7% possible does not exist in live markets.
What to make of it: competitive advantage in causal inference is moving from methodology to infrastructure. The question is not which algorithm but who can generate the most realistic labeled simulations in their domain.
That simulation infrastructure takes time, capital and domain expertise to build. It does not appear in a DDQ. It is not what a backtest reveals. It is exactly the kind of structural advantage that looks like skill until someone asks the right question.
A quant fund with 25,000 realistic domain-specific simulations will beat one with a better algorithm.
In a future issue, I will go deeper into what building this infrastructure actually looks like in practice: what data it requires, what the organizational structure needs to be, and which types of institutions are best positioned to do it. This is among the topics my readers ask about most, and it deserves more than a paragraph.
SIGNAL
In this section I’ll have quick reflections on trends I’m seeing in my conversations with allocators and fund managers.
Quant funds and AI labs are becoming the same machine
DeepSeek was built by High-Flyer, a $14 billion Chinese quant fund that redirected its existing ML infrastructure from predicting prices to predicting tokens. Same GPUs, same data pipelines, same feedback loops. Different output. Both industries run essentially identical operations: large-scale learning systems attached to balance sheets. The technical pipeline, data, model, constraints, execution, feedback, is the same. For allocators, the implication is about competitive moats. The binding constraint is no longer capital alone but deliverable power: energy access, interconnection queues, and the ability to build compute infrastructure on time. Finance still has one advantage as a proving ground: P&L is an unforgiving evaluation metric. Benchmarks can be gamed, revenue can be subsidized. Drawdowns cannot.
The quant toolkit is becoming the most portable skill in tech
The same infrastructure that built DeepSeek is what AI labs are hiring for. ML pipelines, data discipline, statistical intuition: the quant stack transfers directly. Most quant researchers are staying, and the pay and feedback loop make that rational. But a bifurcation is forming. The ones leaving describe something specific: the intellectual challenge of finance started to feel bounded in a way it did not before. They are chasing problems where the upper bound is not visible yet, and every quarter that passes, the people who moved earlier compound further ahead. When those researchers leave, their understanding of why a model works leaves with them. An allocator who does not ask about research team turnover and model documentation is missing a material operational risk.
Job postings are the real prospectus
While we’re on the topic of talent. Barclays separated AI expert hiring from AI generalist hiring by keyword: pytorch and deep learning versus data scientist and machine learning. Companies meaningfully below their sector median on expert hiring averaged -19% equity returns in 2026. Barclays acknowledges the methodology is simplistic, and they are right to. But that is the point. If a crude keyword screen predicts equity underperformance with that kind of signal, allocators running no screen at all are operating with less information than a word search. The difference between pytorch and machine learning in a job posting is the difference between building a capability and describing one. Allocators who do not read job postings are not reading the real prospectus.
EVIDENCE
This is where I reflect on the most relevant recent research at the intersection of AI and capital allocation.
72% of LLM finance studies ignore basic biases
When a quant manager shows you an LLM backtest, the probability that it addresses survivorship bias is roughly one in eighty. A review of 164 papers on LLMs in finance by researchers from Oxford, BlackRock, Chicago Booth and University of Florida finds that each of five key biases, look-ahead, survivorship, narrative, objective and cost, goes unaddressed in at least 72% of studies. Survivorship bias appears in 1.2%. A survey of 50 practitioners finds that 74% report evaluation tools are scarce or non-existent. The field grew from 36 papers in 2023 to 250 in 2025.
One framework to select managers, one to monitor them
Joseph Simonian, head of equity portfolio design at CalPERS, proposes replacing binary pass/fail model validation with a dynamic system built on two continuous dimensions: empirical success and empirical consistency. A model with strong performance but low cross-regime consistency requires fundamentally different oversight than one with modest performance and high consistency. The framework operates post-deployment, tracking how evidence evolves over time rather than issuing a single validation verdict. Where Simonian’s framework governs models already running inside an institution, the SPEC Test addresses the earlier question: what an allocator should ask before committing capital to a manager in the first place. The two frameworks operate at different points in the same problem.
Thanks for reading.